
Global temperatures in 2020 so far were the second highest on record
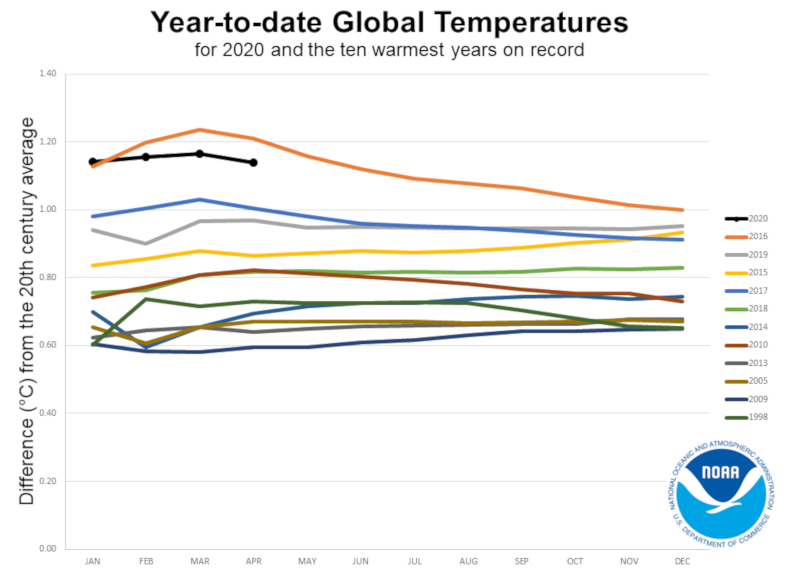 This graphic compares the year-to-date temperature anomalies for 2020 (black dot) to what were ultimately the ten warmest years on record: 2016 (1st), 2019 (2nd), 2015 (3rd), 2017 (4th), 2018 (5th), 2014 (6th), 2010 (7th), 2013 (8th), 2005 (9th), 1998 (tied as 10th) and 2009 (tied as 10th). Each month along each trace represents the year-to-date average temperature anomaly. In other words, the January value is the January average temperature anomaly, the February value is the average anomaly of both January and February, and so on.
The average global land and ocean surface temperature for January–April 2020 was 1.14°C (2.05°F) above the 20th century average of 12.6°C (54.8°F). This was the second highest January–April period on record, only 0.07°C (0.13°F) less than the record warm January–April set in 2016.
The anomalies themselves represent departures from the 20th century average temperature. The graph zooms into the warmest part of the entire history.
NOAA National Centers for Environmental Information, State of the Climate: Global Climate Report for April 2020
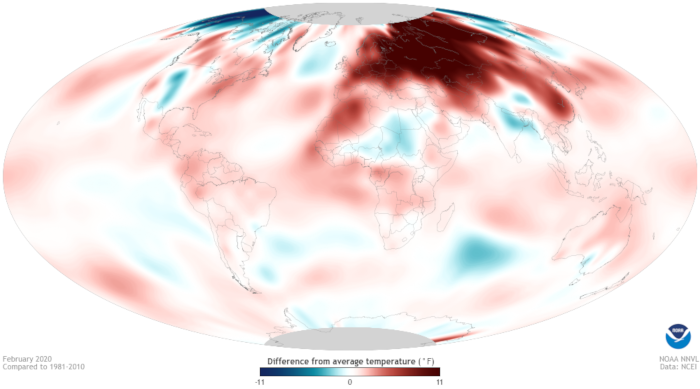
February 2020 was the second-warmest February on record for the globe, and it marked the end to the second-warmest winter on record, too.
- Asia was record-warm in February, with some locations in Siberia experiencing temperatures more than 18°F (10°C) above average.
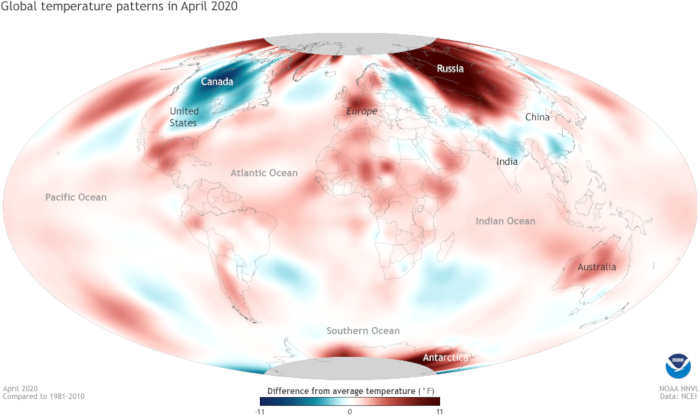
April 2020: another month that’s the second warmest on record
April 2020 continued the last two month’s pattern of being the second warmest on record, which means 2020 is almost certain to be among the four warmest years on record, with a good chance at being the warmest or second warmest on record. While each month has seen different patterns of warmth—details which I will describe below—the overall picture is clear. Our oceans and land are much hotter than they used to be. To read through all of the details of what happened during April 2020, check out the April 2020 global climate summary by the National Centers for Environmental Information.
This map shows the global temperature anomalies in April 2020. Temperature anomalies show how different from normal (1981-2010) temperatures were across the planet. Red colors reflect areas that were up to 11°F (6°C) warmer than average, while blue colors represent areas that were up to 11°F cooler than average. Even though April 2020 was the second-warmest April on record for the globe, there were still areas that observed a cooler than average month.
The largest “hotspot,” where temperatures were the most above average, was in northern Asia, where temperatures were over 11°F warmer than normal. Other areas, including central Europe, western Australia, and much of Africa and South America observed warmer than average temperatures as well. The one cooler-than-average outlier was across Canada and the eastern contiguous United States, where April temperatures were over 2°C (3.6°F) below average. This highlights how even if temperatures are very different than normal where you live, the global picture can be drastically different.
Overall, April global temperature was 1.91°F (1.06°C) above the twentieth-century average, making April 2020 the second-warmest April in the 141-year record. Only this past April and April 2016 (the warmest April on record) had global temperature anomalies above 1°C (1.8°F). It was also the 44th consecutive April and 424th consecutive month with temperatures above the twentieth-century average. Nearly 7% of the planet observed record-high April temperatures. No areas observed record-cold monthly temperatures.
Tom di Liberto, NOAA, climate.gov / May 2020
Schreibe einen Kommentar