
Mauna Loa: Can we see a change in the CO2 record because of COVID-19?
The Mauna Loa Observatory on the island of Hawaii is known for the continious monitoring of atmospheric carbon dioxide.
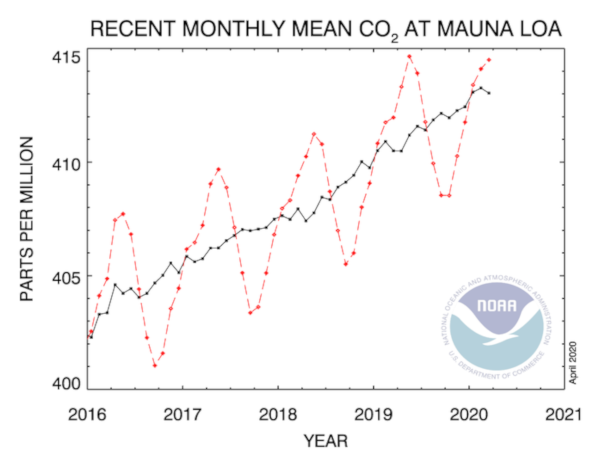
The graphs show monthly mean carbon dioxide measured at Mauna Loa Observatory, Hawaii. The carbon dioxide data (red curve), measured as the mole fraction in dry air, on Mauna Loa constitute the longest record of direct measurements of CO2 in the atmosphere.
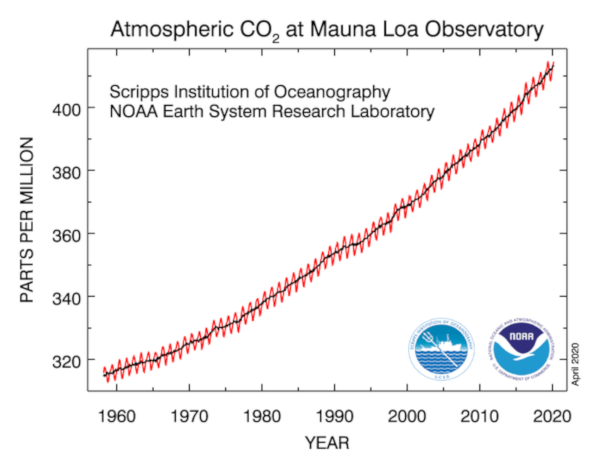
The last four complete years of the Mauna Loa CO2 record plus the current year are shown in the first graph. The full record of combined Scripps data and NOAA data are shown in the second graph. The dashed red lines with diamond symbols represent the monthly mean values, centered on the middle of each month. The black lines with the square symbols represent the same, after correction for the average seasonal cycle. The latter is determined as a moving average of SEVEN adjacent seasonal cycles centered on the month to be corrected, except for the first and last THREE and one-half years of the record, where the seasonal cycle has been averaged over the first and last SEVEN years, respectively.
Here are the monthly average data for the month of March during the last 6 years.
March 2020: 414.50 ppm +2.53
March 2019: 411.97 ppm +2,56
March 2018: 409.41 ppm +2.19
March 2017: 407.22 ppm + 2.35
March 2016: 404.87 ppm +3.33
March 2015: 401.54 ppm +1.77
March 2014: 399.77 ppm
There is an average increase in the values of 2,46 ppm, the deviations from the mean value are up to -0.69ppm /+0,87 ppm. These deviations are are due to the seasonal and annual variations of temperature, humidity, soil moisture etc. As these natural variations are comparatively large, a possible covid-19 impact might be hard to detect.
As to the question if the data show a possible reduction in carbon dioxide emissions because of the covid-19 measurements the MLO says:
There have been many inquiries whether we can see in our CO2 measurements at Mauna Loa and elsewhere the slowdown in CO2 emissions from the burning of fossil fuels. That drop in emissions needs to be large enough to stand out from natural CO2 variability caused by how plants and soils respond to seasonal and annual variations of temperature, humidity, soil moisture, etc. These natural variations are large, and so far the „missing“ emissions do not stand out, but we may see them as the year progresses. Here is an example: If emissions are lower by 25%, then we would expect the monthly mean CO2 for March at Mauna Loa to be lower by about 0.2 ppm. When we look at many years of the difference between February and March we expect March to be higher by 0.74 ppm, but the year-to-year variability (one standard deviation) of the difference is 0.40 ppm. This year the difference is 0.40 ppm, or 0.33 below average, but last year it was 0.52 ppm below average.
Most of the emissions come from urban areas, so that it may be easier to see the effect downwind of cities, although also in that case they need to stand out from natural variations. Only measurements of carbon-14 in CO2 would enable us to cleanly separate fossil sources of CO2 from ecosystem sources and sinks regardless of how variable the latter are. (NOAA, Global MonitoringLaboratory)
Though there is obviuosly a reduction of CO2 emissions due to the cvid-19 lockdowns worlwide, the Mauna Loa observations haven’t shown this so far.
NOAA, Global Monitoring Laboratory, April 2020
Bernd Riebe
See also at Blue Blog: The impacts of the covid-19 crisis on global CO2-emissions and the climate
Schreibe einen Kommentar