
Time is running out -Possible Climate Futures – IPCC Key Findings
In the following, I would like to summarise the main findings of the IPCC report, in particular taking into account the different future scenarios under the possible consequences.
The latest IPCC report ( AR6) assesses the climate response to five illustrative scenarios that cover the range of possible future development of anthropogenic drivers of climate change found in the literature.
They include
- scenarios with high and very high GHG emissions (SSP3-7.0 and SSP5-8.5) and CO2 emissions that roughly double from current levels by 2100 and 2050, respectively
- scenarios with intermediate GHG emissions (SSP2-4.5) and CO2 emissions remaining around current levels until the middle of the century,
- scenarios with very low and low GHG emissions and CO2 emissions declining to net zero around or after 2050, followed by varying levels of net negative CO2 emissions (SSP1-1.9 and SSP1-2.6)
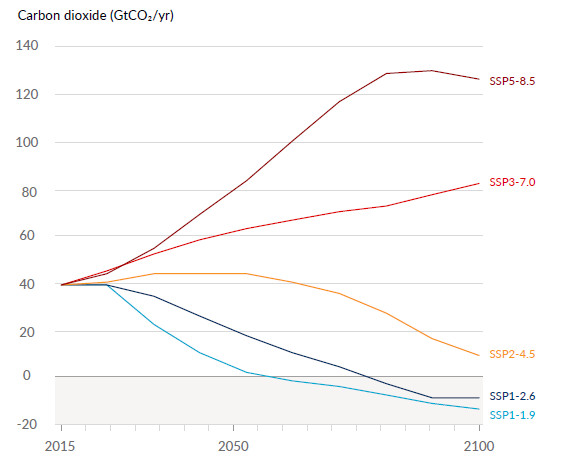
Future annual emissions of CO2
Global surface temperature will continue to increase until at least the mid-century under all emissions scenarios considered. Global warming of 1.5°C and 2°C will be exceeded during the 21st century unless deep reductions in CO2 and other greenhouse gas emissions occur in the coming decades.
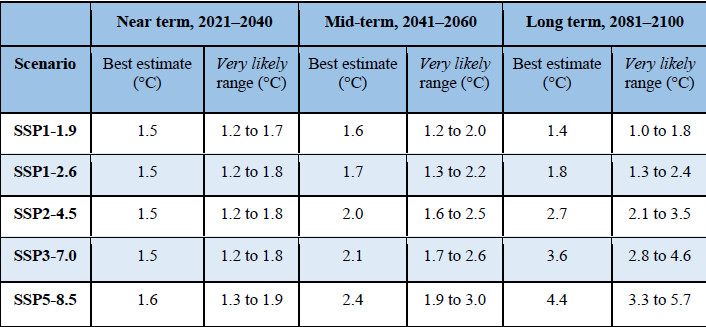
Based on the assessment of multiple lines of evidence, global warming of 2°C, relative to 1850– 1900, would be exceeded during the 21st century under the high and very high GHG emissions scenarios (SSP3-7.0 and SSP5-8.5, respectively).
♦Global warming of 2°C would extremely likely be exceeded in the intermediate scenario (SSP2-4.5).
♦Under the very low and low GHG emissions scenarios, global warming of 2°C is extremely unlikely to be exceeded (SSP1-1.9), or unlikely to be exceeded (SSP1-2.6)
♦Crossing the 2°C global warming level in the mid-term period (2041–2060) is very likely to occur under the very high GHG emissions scenario (SSP5-8.5), likely to occur under the high GHG emissions scenario (SSP3-7.0), and more likely than not to occur in the intermediate GHG emissions scenario (SSP2-4.5)
Simulated annual mean temperature change.
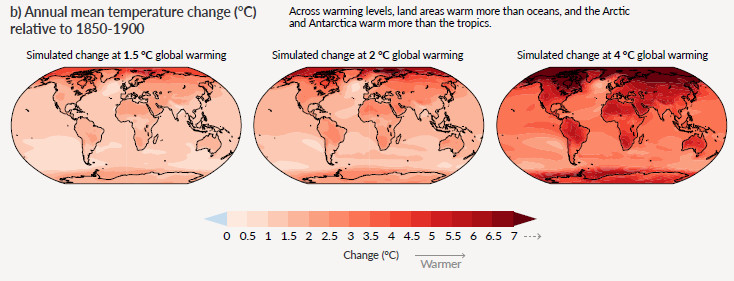
Simulated annual mean temperature change. The northern regions will be most affected. Land areas warm more than oceans. The Arctic and Antarctica warm more than the tropics.
Simulated annual mean precipitation change

Simulated annual mean precipitation change in percent. Increase over highe latitudes part of the mosoon regions and equitorial Pacific, decrease over parts of the subtropics.
Projected changes in extremes are larger in frequency and intensity with every additional increment of global warming
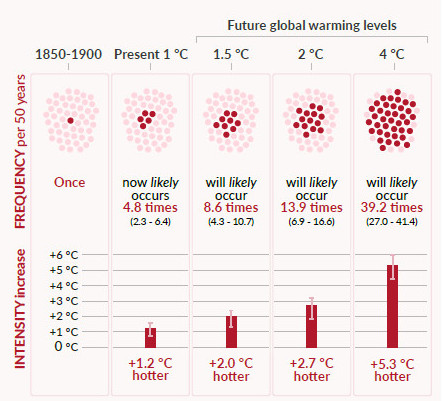
Hot extremes over land – 50 year event – Frequency and increase in intensity of extreme temperature event that occurred once in 50 years on average in a climate without human influence
The proportion of CO₂ emissions taken up by land and ocean carbon sinks is smaller in scenarios with higher cumulative CO₂ emissions
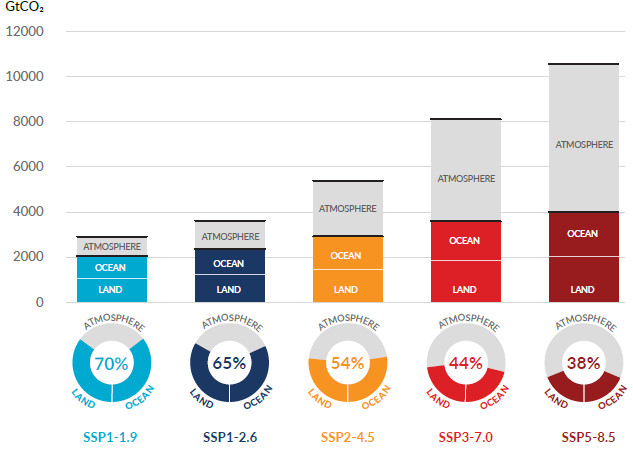
The bar chart illustrates the projected amount of cumulative anthropogenic CO2 emissions (GtCO2) between 1850 and 2100 remaining in the atmosphere (grey part) and taken up by the land and ocean (coloured part) in the year 2100
The doughnut chart illustrates the proportion of the cumulative anthropogenic CO2 emissions taken up by the land and ocean sinks and remaining in the atmosphere in the year 2100. Values in % indicate the proportion of the cumulative anthropogenic CO2 emissions taken up by the combined land and ocean sinks in the year 2100.
In scenarios with low CO2 emissions the proportion of CO2 taken up by land and ocean is quite large – up to 70%, whereas scenarios with high CO2 emissions, the proportion is much smaller, about 40%., this means that 60% remain in the atmosphere and thus ensure a further increase in global temperature.
Low-likelihood outcomes, such as ice sheet collapse, abrupt ocean circulation changes, some compound extreme events and warming substantially larger than the assessed very likely range of future warming cannot be ruled out and are part of risk assessment.
Low-likelihood, high-impact outcomes could occur at global and regional scales even for global warming within the very likely range for a given GHG emissions scenario. The probability of low-likelihood, high impact outcomes increases with higher global warming levels (high confidence). Abrupt responses and tipping points of the climate system, such as strongly increased Antarctic ice sheet melt and forest dieback, cannot be ruled out (high confidence).
If global warming increases, some compound extreme events with low likelihood in past and current climate will become more frequent, and there will be a higher likelihood that events with increased intensities, durations and/or spatial extents unprecedented in the observational record will occur (high confidence).
The Atlantic Meridional Overturning Circulation (AMOC) is very likely to weaken over the 21st century for all emission scenarios.
While there is high confidence in the 21st century decline, there is only low confidence in the magnitude of the trend. There is medium confidence that there will not be an abrupt collapse before 2100. If such a collapse were to occur, it would very likely cause abrupt shifts in regional weather patterns and water cycle, such as a southward shift in the tropical rain belt, weakening of the African and Asian monsoons and strengthening of Southern Hemisphere monsoons, and drying in Europe.
The AMOC is a large system of ocean currents, like a conveyor belt, driven by differences in temperature and salt content – the water’s density. The Gulf Stream is part of it.
Limiting Future Climate Change
From a physical science perspective, limiting human-induced global warming to a specific level requires limiting cumulative CO2 emissions, reaching at least net zero CO2 emissions, along with strong reductions in other greenhouse gas emissions. Strong, rapid and sustained reductions in CH4 emissions would also limit the warming effect resulting from declining aerosol pollution and would improve air quality.
Every tonne of CO₂ emissions adds to global warming
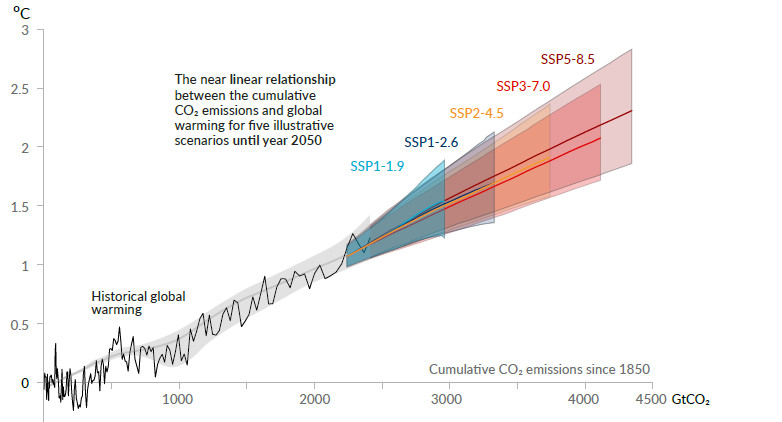
Global surface temperature increase since 1850-1900 (OC) as a function of cumulative CO₂ emissions (GtCO₂) Over the period 1850–2019, a total of 2390 ± 240 (likely range) GtCO2 of anthropogenic CO2 was emitted.
This Report reaffirms with high confidence the AR5 finding that there is a near-linear relationship between cumulative anthropogenic CO2 emissions and the global warming they cause.
Each 1000 GtCO2 of cumulative CO2 emissions is assessed to likely cause a 0.27°C to 0.63°C increase in global surface temperature with a best estimate of 0.45°C.
Global anthropogenic GHG emissions today are approximately 36 Gt CO2/yr so business as usual would result in another 1000 GtCO2 or an increase of 0.45 C by 2050 thus exceeding the 1.5 C limit.
Estimates of historical CO2 emissions and remaining carbon budgets.
Estimated remaining carbon budgets are calculated from the beginning of 2020 and extend until global net zero CO2 emissions are reached. They refer to CO2 emissions, while accounting for the global warming effect of non-CO2 emissions. Global warming in this table refers to human-induced global surface temperature increase, which excludes the impact of natural variability on global temperatures in individual years.
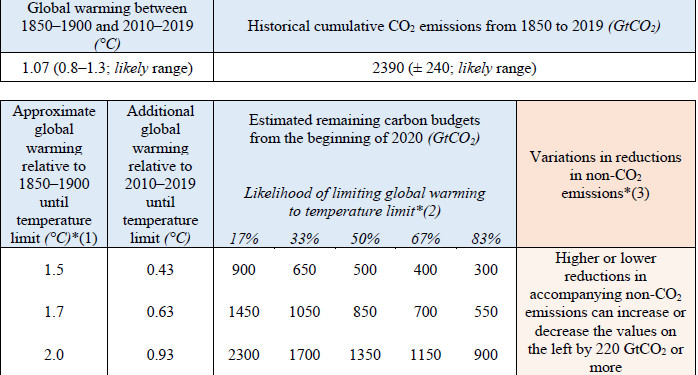
This is a very interesting table that provides information on how much CO2 may still be emitted so that certain climate targets can be achieved. I would like to explain this with an example. In order to limit warming to 1.5 degrees, the atmosphere may only warm by 0.43 degrees, since a relative temperature increase of approx. 1.1 degrees has already been achieved. To achieve this goal with a probability of 83%, only 300GtCO2 may be emitted into the atmosphere from 2020. With current emissions of 36 GtCO2, the 1.5 degree limit would be reached in about 8 years, i.e. before 2030!
To keep the temperature increase below 2 degrees, the triple amount would have to be emitted, i.e. 900 GtCO2, which would take 25 years if emissions remain unchanged from today, i.e. in 2046 this limit would also be exceeded, with catastrophic consequences.
Here, however, only carbon dioxide is considered the most important driver of climate change. Non-CO2 emissions such as methane and nitrous oxide, among others, can reduce or increase the carbon budget by up to 220 GtCO2, depending on the emissions, and thus extend or even shorten the remaining time by up to 6 years.
Bernd Riebe, AUG 2021
based on IPCC, 2021: Summary for Policymakers. In: Climate Change 2021: The Physical Science Basis. Contribution of Working Group I to the Sixth Assessment Report of the Intergovernmental Panel on Climate Change
The author studied geosciences at the Ruhr University in Bochum and worked as a lecturer at educational institutions in Germany. Research stays in Antarctica, New Zealand and Africa.
Schreibe einen Kommentar